Keywords: Electric fences, Faults, Raspberry Pi TDR, Data collection
Data Collection at Ol Pejeta Conservancy for the Raspberry Pi TDR Project
A visit to Ol Pejeta for data collection.
Electric fences are used to create Protected Areas (PAs) to help preserve biodiversity, provide habitat to wildlife, and reduce Human Wildlife Conflicts (HWCs). Electric fences are prone to faults that affect their operation. The most common causes of faults in electric fences include broken wires, overgrown vegetation touching the fence, poor grounding, bad connection, branches falling on the fence, and broken insulators. The faults need to be detected and repaired for the effective performance of the fences. The most common method of detecting faults in an electric fence involves conducting routine measurement of the fence voltage. If the voltage falls below a given value, the fence is said to be faulty. To locate the fault, an authorized person is required to walk along the fence measuring the voltage of the fence. The voltage drops continually up to the faulty point and then remains constant or drops to zero past the fault. This method of detecting and locating faults is inefficient, time-consuming, and labourious since the fences are exceptionally long.
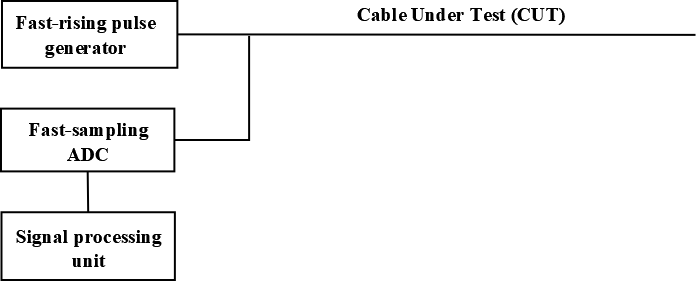
At the Centre for Data Science and Artificial Intelligence (DSAIL), we are developing a Raspberry Pi based Time Domain Reflectometer (TDR) to detect and locate faults in electric fences. The system works using the principle of time domain reflectometry. Read this blog to learn more about the TDR. The TDR has a time domain reflectometry algorithm that processes sampled signals to detect and locate faults in electric fences. The algorithm was developed using data collected from experiments conducted using two 15 m copper cables and the Raspberry Pi TDR. Open circuit and short circuit faults are common in electric fences. A short circuit fault occurs when a live wire comes into contact with a neutral wire. An open circuit fault in electric fences is caused by the breakage of wires due to loose connections, vandalism, or damage caused by animals. Breakage of electric fence wires will most likely eventually result in a short circuit fault. Open circuit and short circuit faults were simulated on one end of the copper cables and a step signal was applied to the other end. Signal samples were taken at the input using the TDR and saved on the storage of the Raspberry Pi.
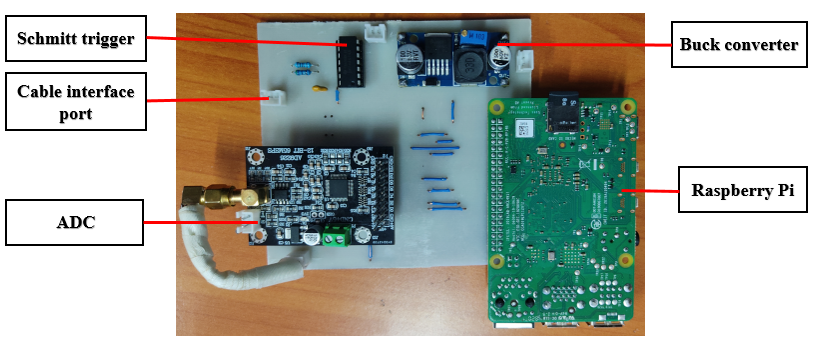
Figure 1: The Raspberry Pi based TDR.
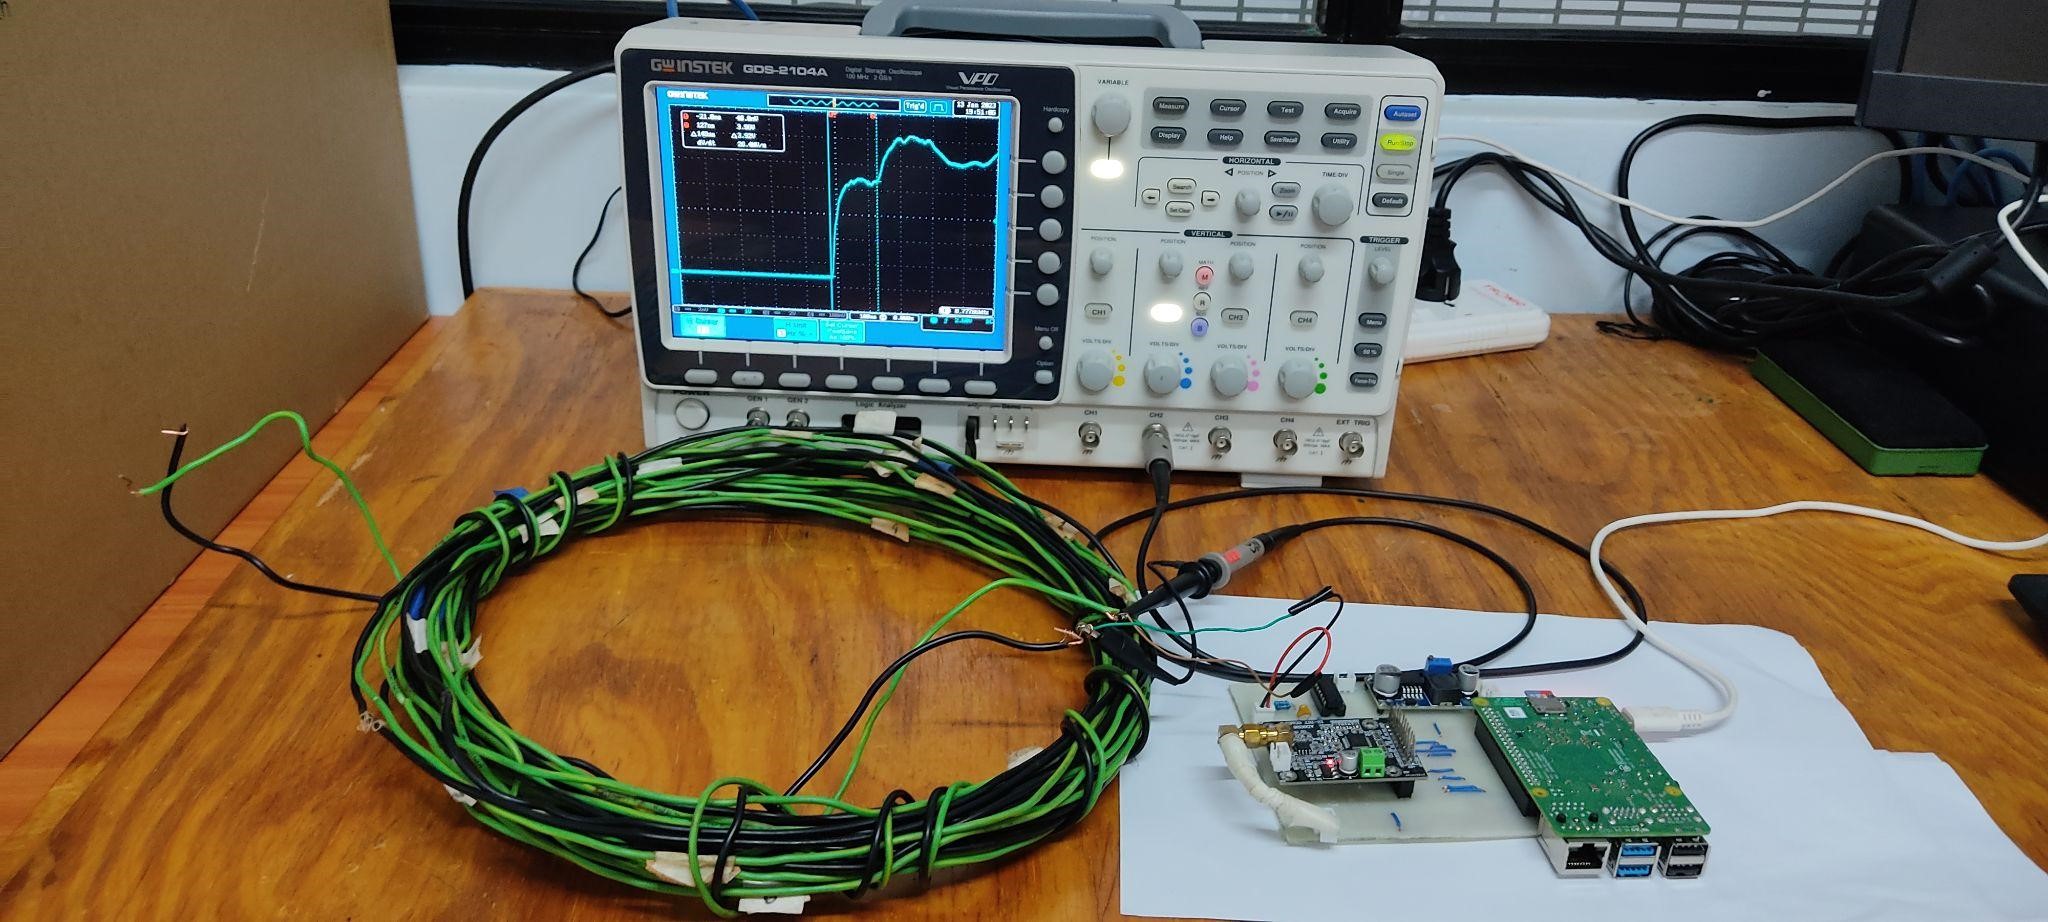
Figure 2: Setup to simulate open circuit and short circuit faults using two 15 m copper cables and the Raspberry Pi TDR.
The time domain reflectometry algorithm is based on change point detection using the method of discrete gradient. The performance of the time domain reflectometry algorithm was evaluated using electric fences. A 108 m long section of the electric fence at the Dedan Kimathi University of Technology Wildlife Conservancy (DeKUTWC) and a 280 m long section of an electric fence at Ol Pejeta Conservancy were used. Two strands of the electric fence sections were used to simulate open circuit and short circuit faults and data was collected from these experiments. The time domain reflectometry algorithm was able to detect and distinguish between the open circuit and short circuit faults and predict the distance to these faults within ±1.52 m of the actual distance. The Raspberry Pi TDR needed to be evaluated using a longer fence to ascertain its applicability in monitoring long fences. It is for this reason that we decided to visit Ol Pejeta Conservancy and conduct experiments using a longer electric fence. Our goal was to simulate faults with a 1 km long fence and collect data.
On 26th April 2023, we started the trip to Ol Pejeta Conservancy from Dedan Kimathi University of Technology (DeKUT) at around 8:30 am. The team comprised Mr Mathenge (a technologist at DeKUT), Dishan Otieno (an undergraduate research assistant at DSAIL), and I (Gabriel Kiarie, a research intern at DSAIL). We arrived at Ol Pejeta at around 10:00 am and headed for the Conservation Tech Lab to meet Mr Kennedy and brief him on our plans. We left the lab for the section of the fence that we were to use for the data collection exercise. We were joined by a ranger and a fence man on the way.
When we arrived at the fence, we began by inspecting it to assess its suitability for use to conduct the experiments. The fence was suitable and the fence man disconnected the energiser from it to allow us to conduct the experiments. The Raspberry Pi TDR was placed in an adapter box, connected to the top two strands of the electric fence, and powered ON.
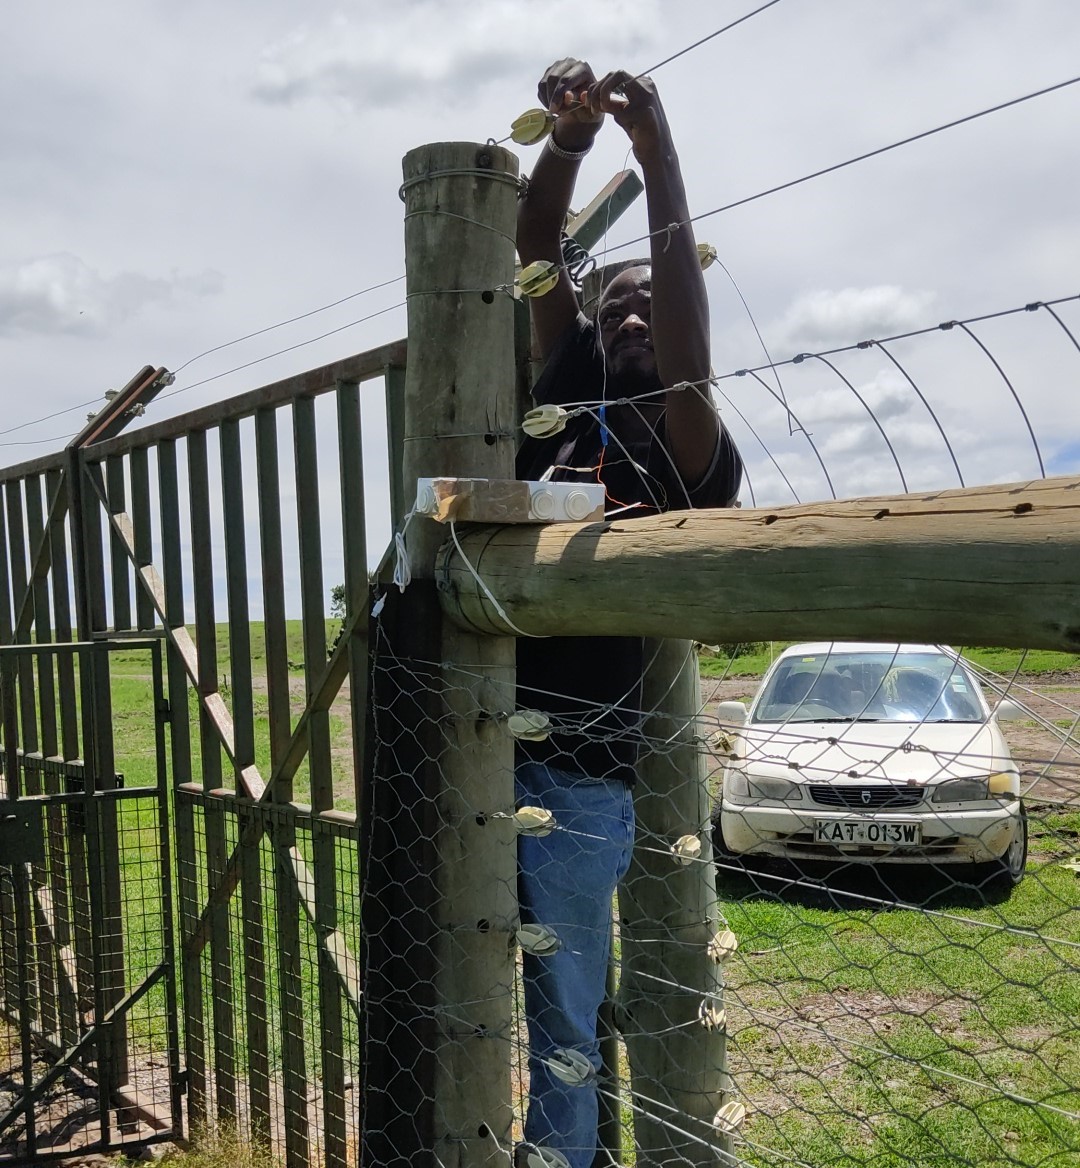
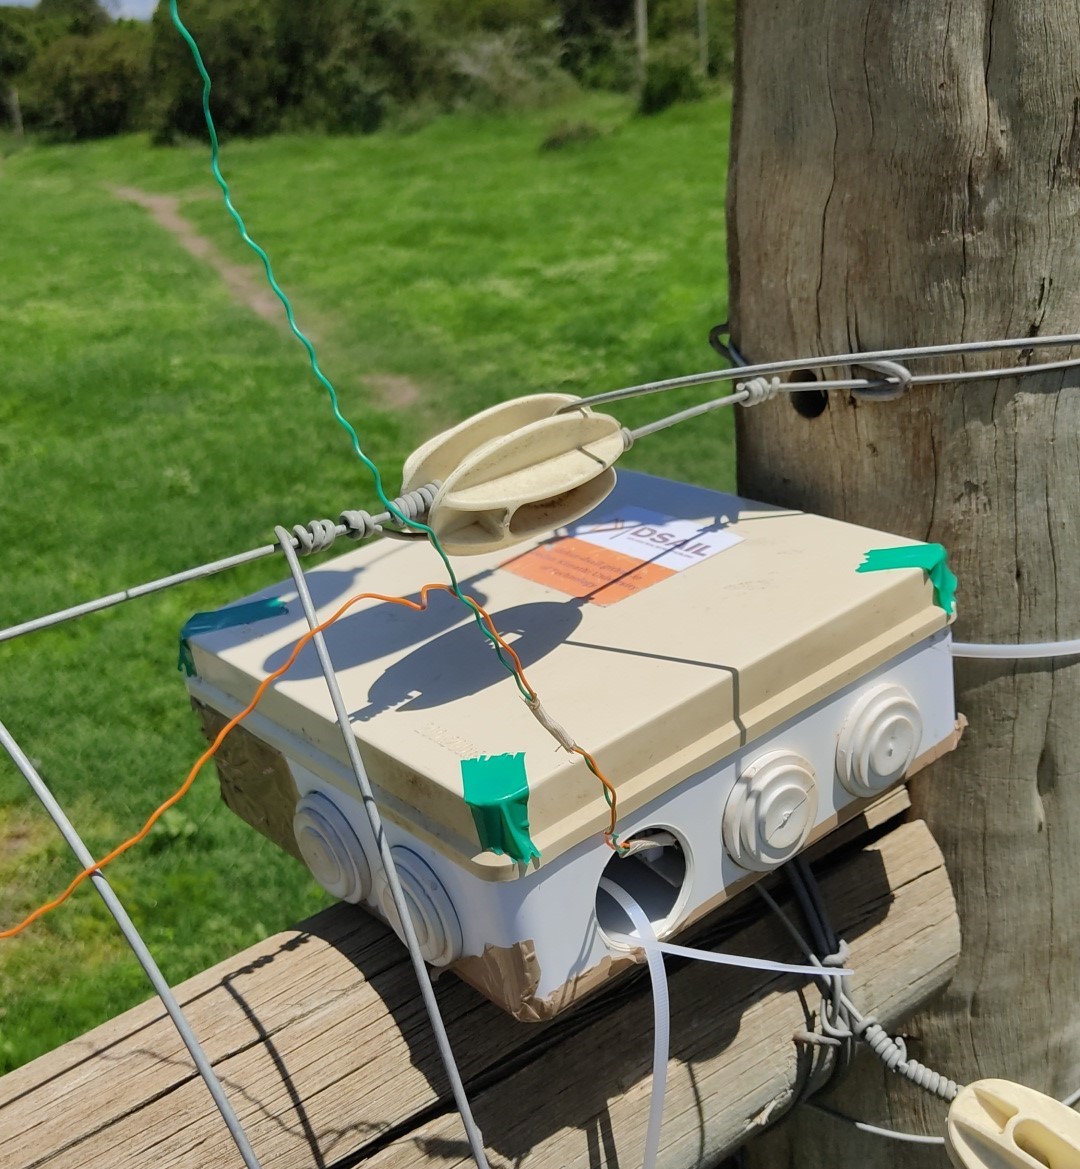
Figure 3: Connecting the Raspberry Pi TDR to the electric fence (left); and the Raspberry Pi TDR connected to the electric fence (right).
Open circuit and short circuit faults were simulated at intervals along the fence. Open circuits were created by disconnecting the junctions created at two of the fence's segments. The end of the fence's wires was also treated as an open circuit. Short circuits were created by connecting the two electric fence strands using a conductor. The first short circuit was created 12 m from the start of the fence. The other short circuits were created at 30 m intervals from the 12 m mark except the last one which was 10.7 m apart from the second last short circuit. Figure 3 shows how a short circuit was created.
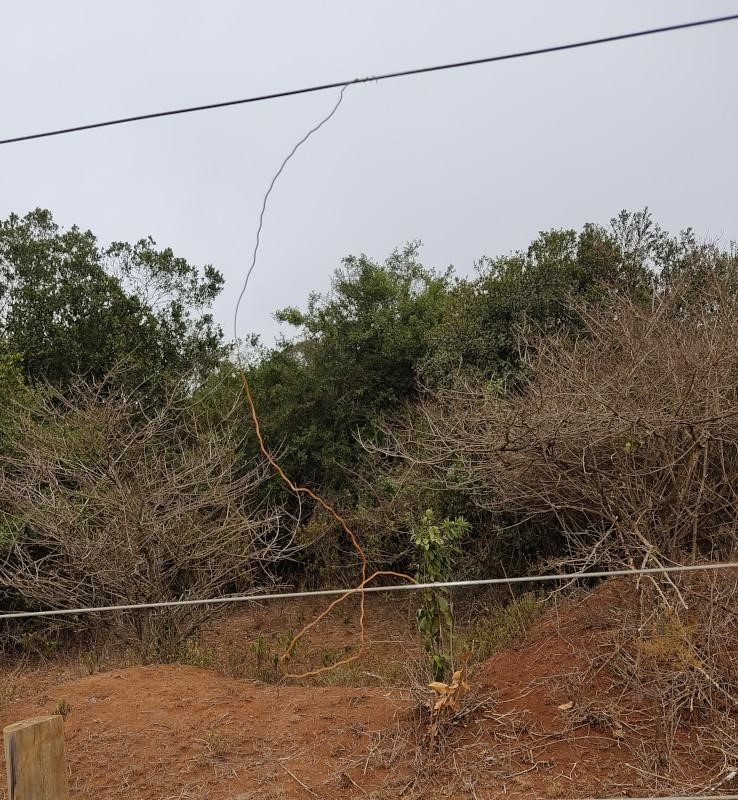
Figure 4: A conductor connected to two electric fence strands to create a short circuit.
3 open and 33 short circuit instances were created. For each instance, 20 files of sampled signals were collected and saved. Each file contains about 0.3 ms long sampled signal. In total, 720 files were collected. The files will be analysed and the results used to assess the performance of the Raspberry Pi TDR. The section of the fence used was about 952 m long.
The data collection exercise was successful despite us racing against time and worrying about the impending rains. Being in nature, we also got to enjoy what it had to offer. I, in particular, was fascinated by the sight of a dung beetle rolling what seemed to be a perfectly moulded ball. For a moment I thought we do not give enough credit to the intelligence of some of the animals. We also got a chance to see an elephant from a very close distance.
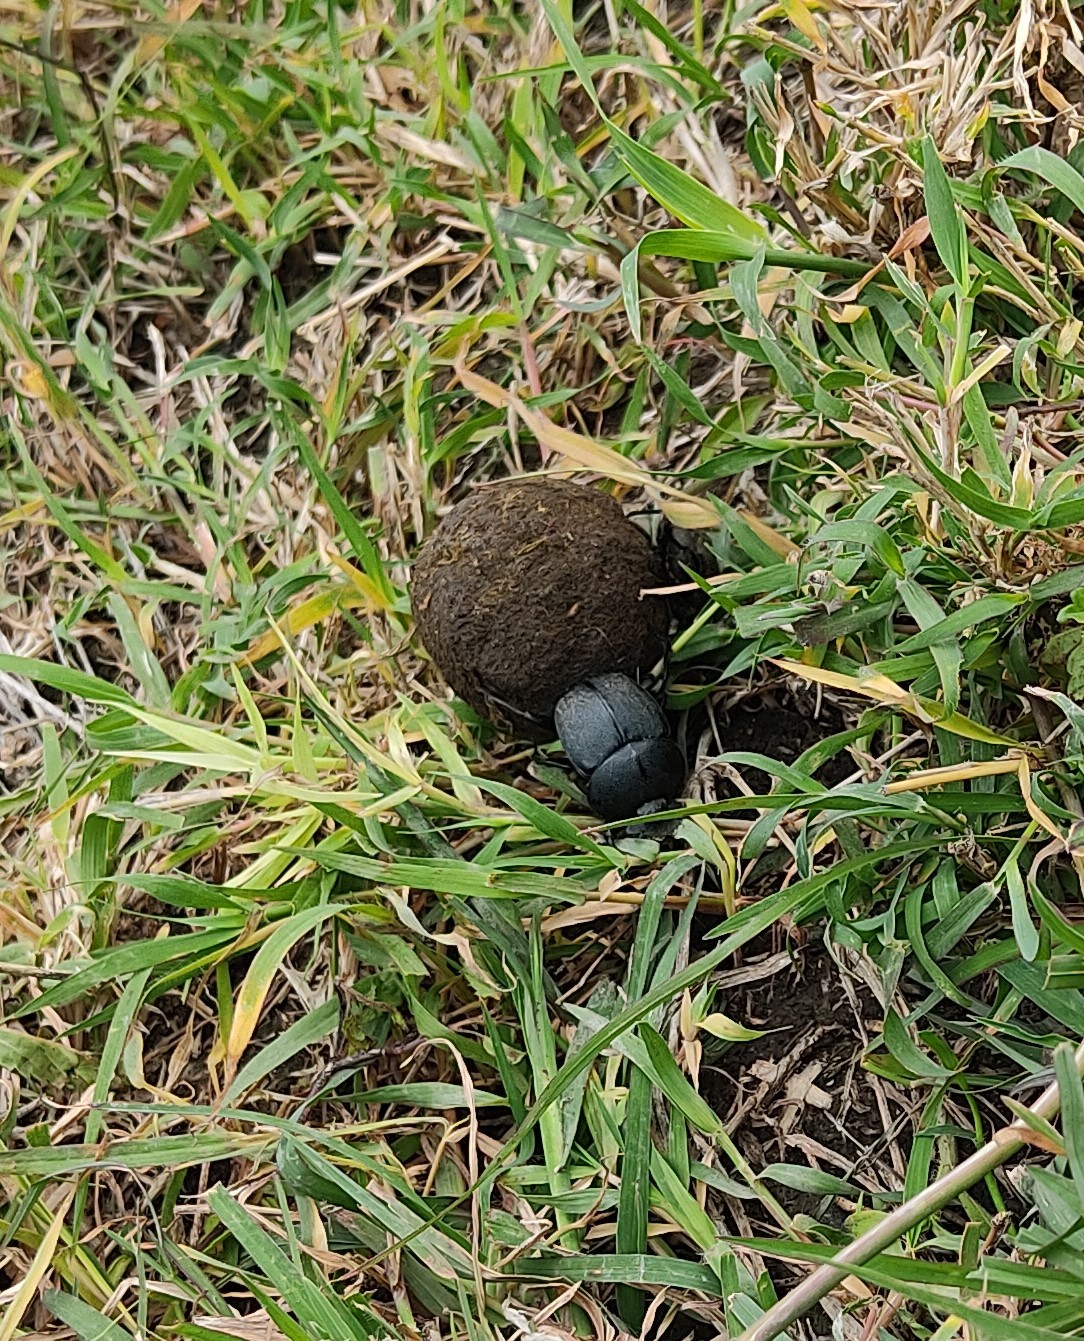
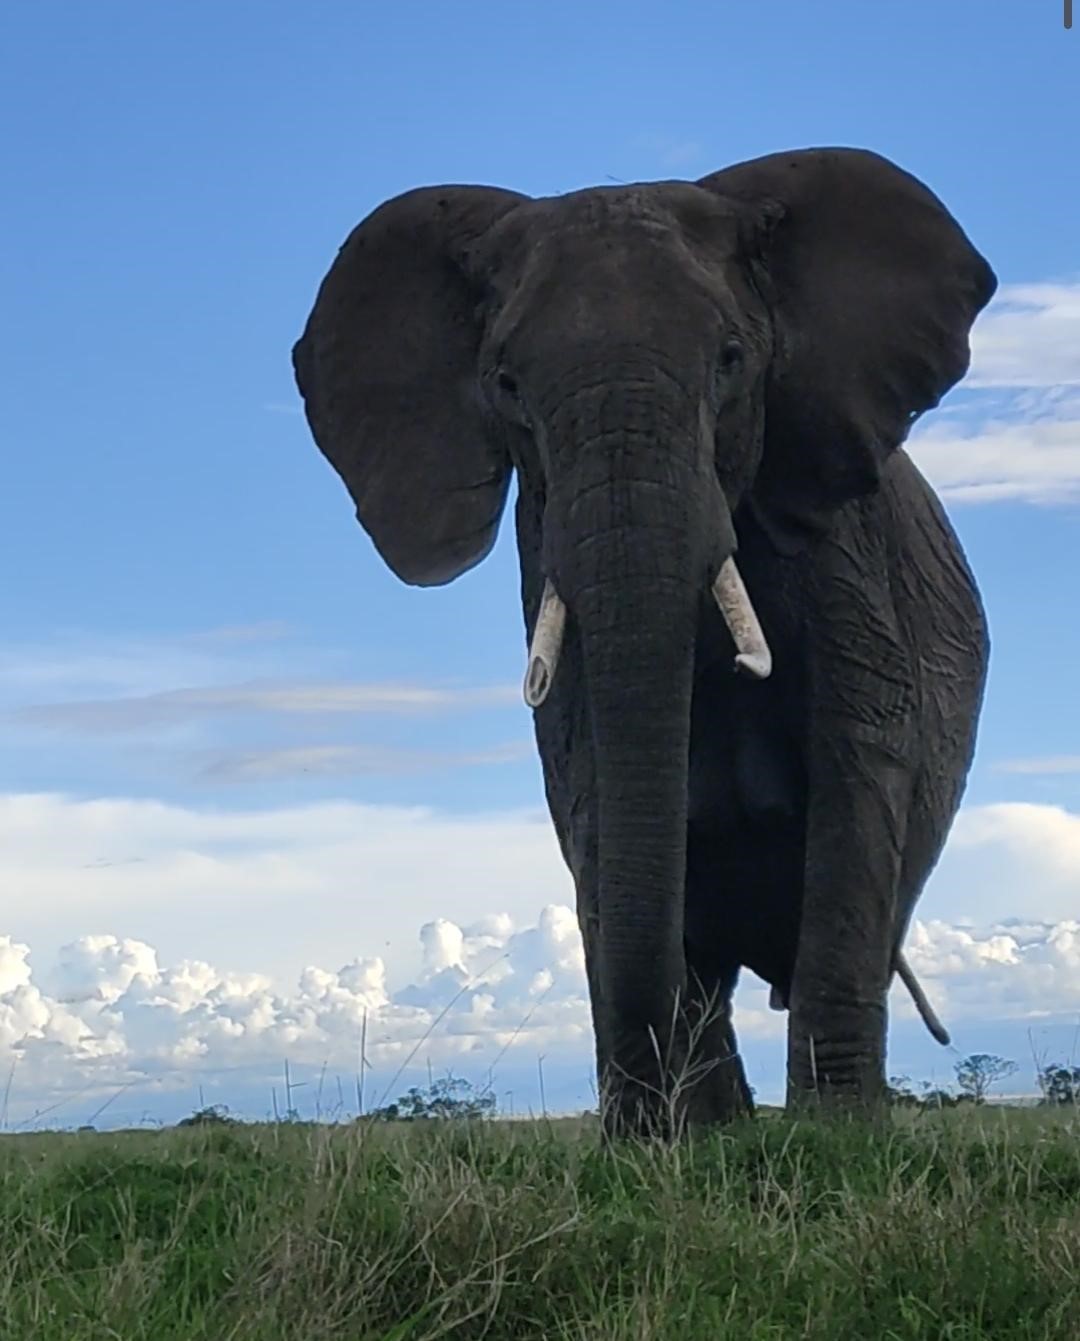
Figure 5: A dung beetle rolling a ball (left); and a close up snapshot of an elephant (right).